Highway-rail grade crossings in the United States. Reading territorial exposure before the next program step
This page is written for teams who compare highway-rail grade crossing candidates before the next program step. That includes state department of transportation teams, railroads, local road agencies, metropolitan planning organizations, counties, ports, public funders, insurers and infrastructure risk readers.
The official U.S. base already gives those readers a structured starting point. The national inventory makes crossings visible. Accident data and public scoring make safety risk comparable. Section 130 and the Railroad Crossing Elimination Program give project pathways.
The question explored here sits just before the next commitment. When several crossings can move toward field review, grant preparation, engineering scope, closure, separation or capital planning, the surrounding territory can add a second comparison layer.
SAMRoute publishes this page as a comparative reading of that question.
1. Before the next program step
A U.S. crossing first enters the national inventory as a public record. Accident history then attaches to that record. A public model scores its risk. Funding programs can then move selected crossings toward diagnostics, upgrades, closures or separations.
The decision point comes before that movement hardens into a project. A team may be comparing candidate sites, preparing a Section 130 pipeline, shaping an RCE application, reviewing a closure, framing a separation or deciding where field work should go next.
At that moment, the crossing is still a record and a score, but it is also a place with roads, detours, emergency access, nearby uses and local exposure around it.
Different readers meet that sequence through different responsibilities.
- State DOT teams may read it through candidate prioritization, Section 130 pipelines, RCE preparation and diagnostic review.
- Railroads may read it through shared road and rail exposure, closures, separations, blocked access and local coordination.
- MPOs, counties, ports and cities may read it through mobility, emergency access, detours, land use and local project framing.
- Risk and finance readers may read it through exposure accumulation, repeatable variables and portfolio comparison.
- International rail readers may read it as a U.S. case that differs from France, Great Britain and Spain.
2. The U.S. public base
The United States offers one of the most visible highway-rail grade crossing systems in the world, and that visibility starts with a single public record.
The U.S. DOT National Highway-Rail Crossing Inventory holds every crossing on the network, each with a unique identifier, a location, the operating railroad, the warning devices in place and the road and rail traffic that uses it [8, ↗]. Every railroad reports the crossings on its track into that inventory under federal reporting rules, and the data stays open to query and download [9, ↗].
Because the record is public and consistent, more than 200,000 highway-rail crossings can be read from the same national inventory [8, ↗].
Behind each inventory record is a place on the ground. Here are nine U.S. crossings at street level, in California and New York.
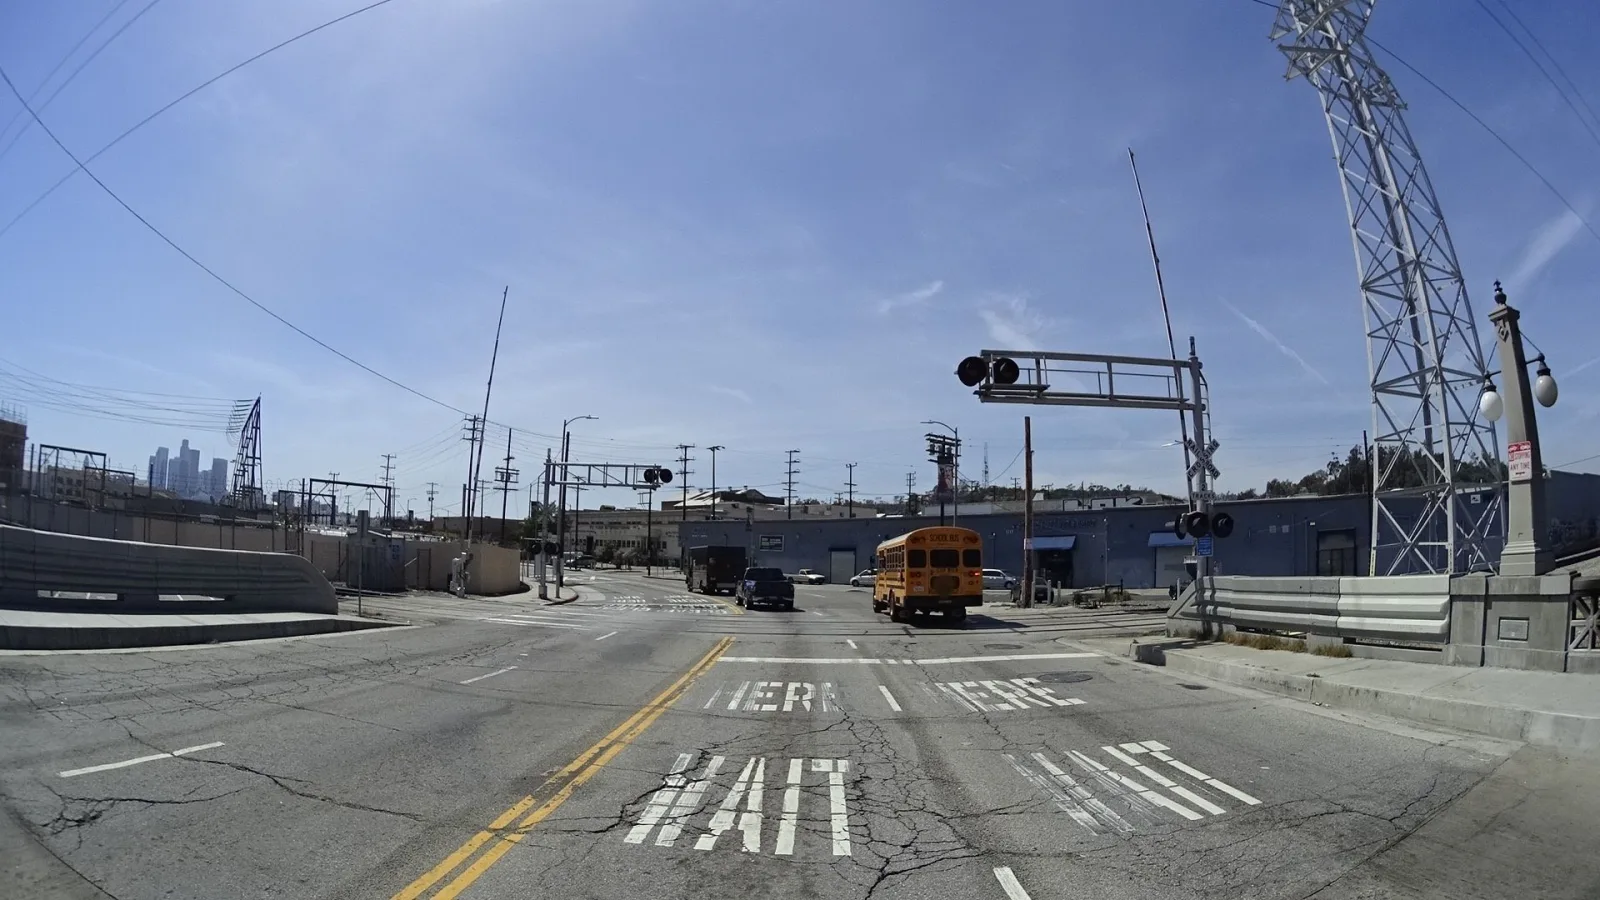
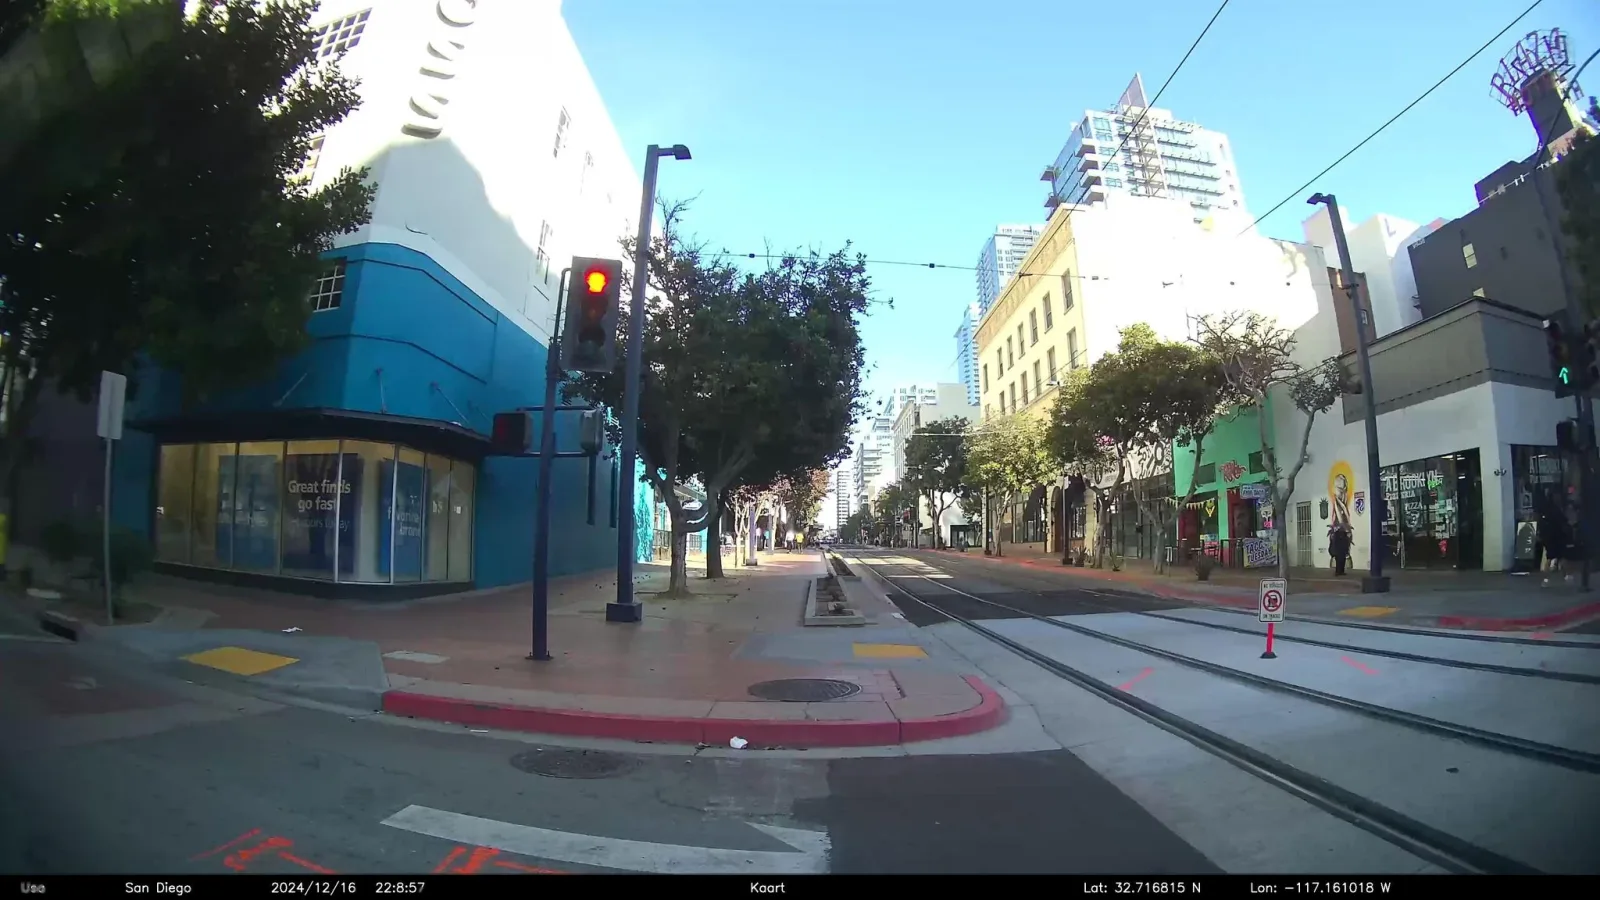
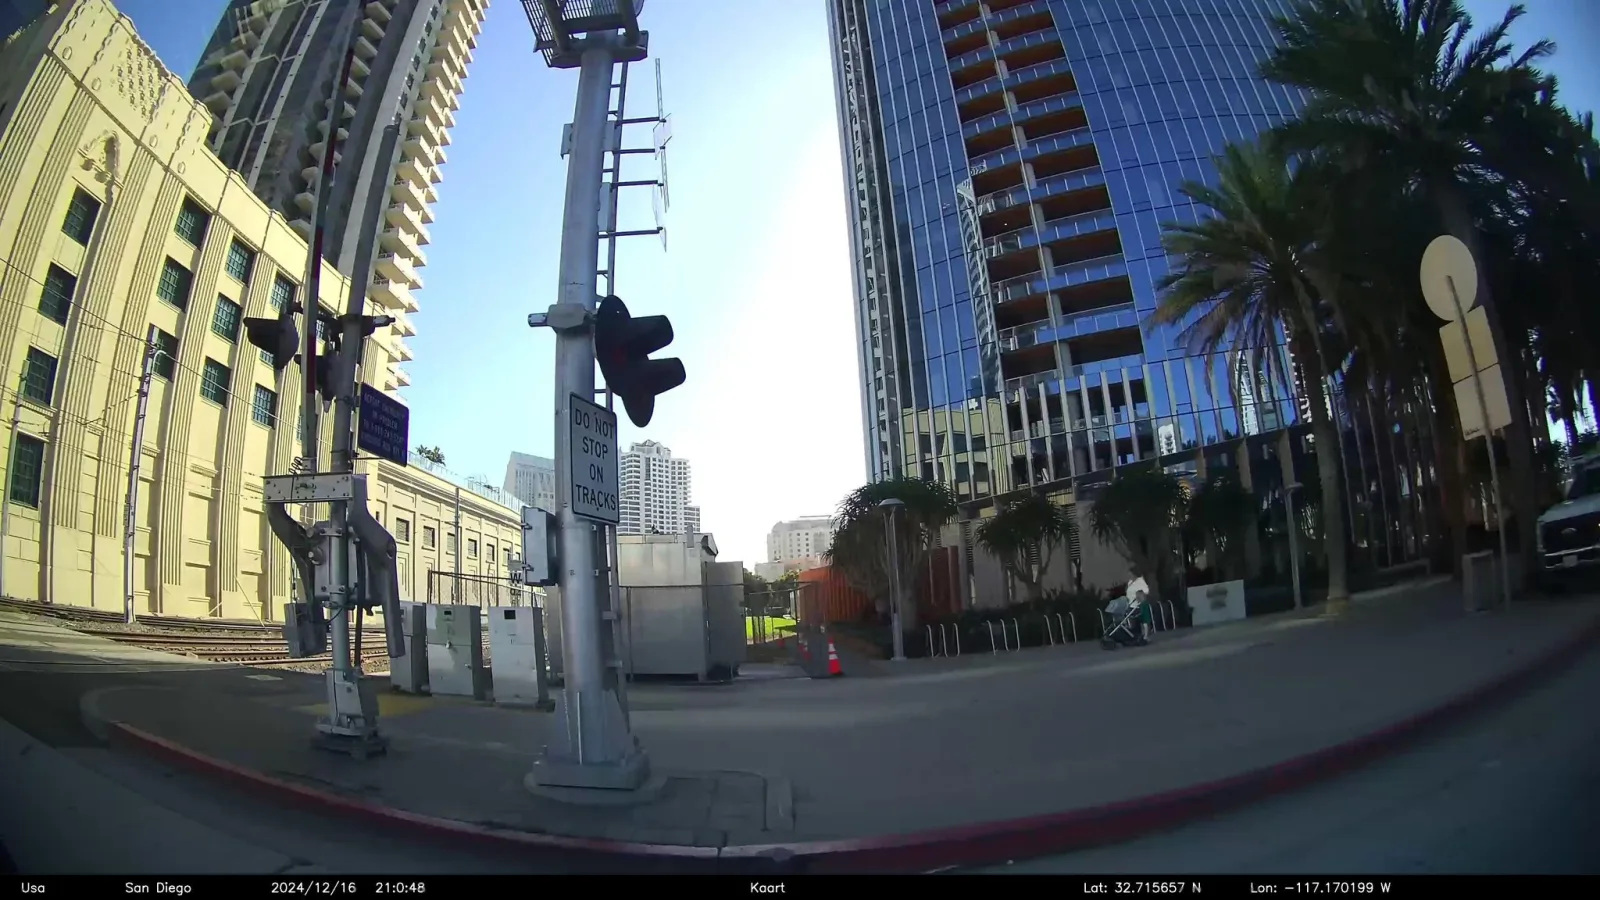
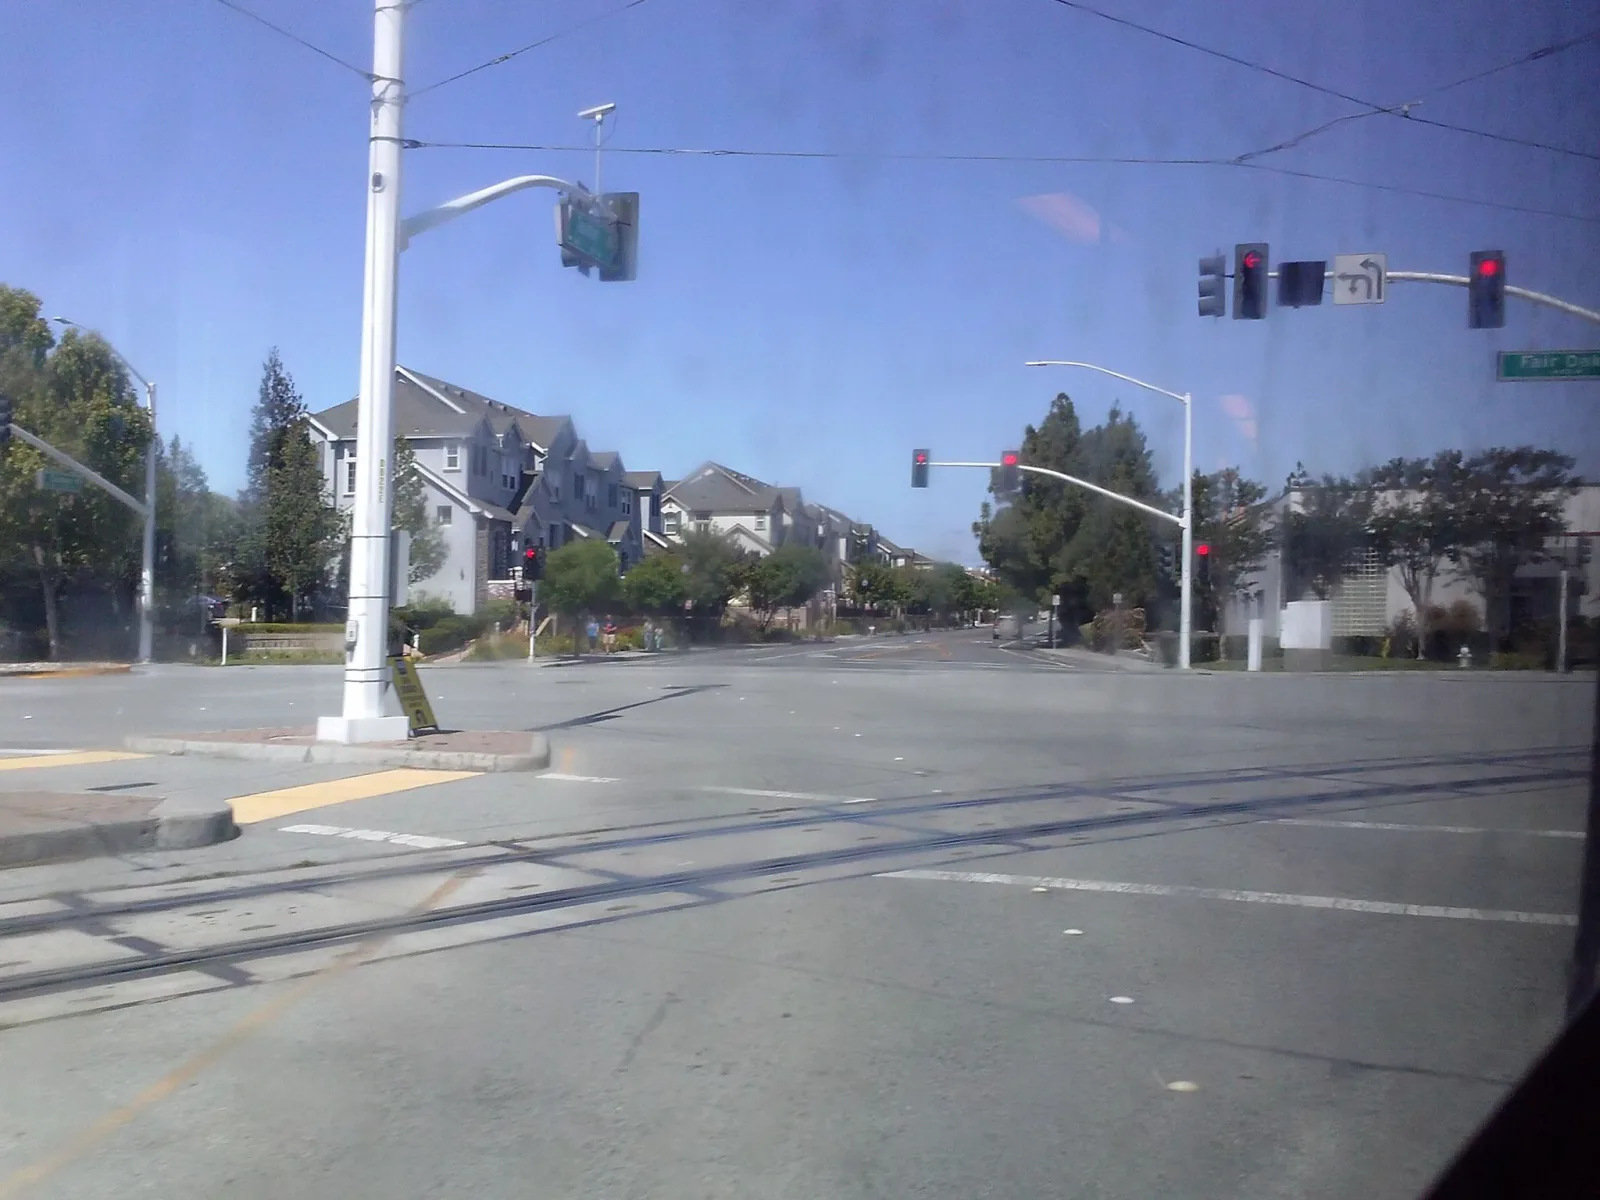
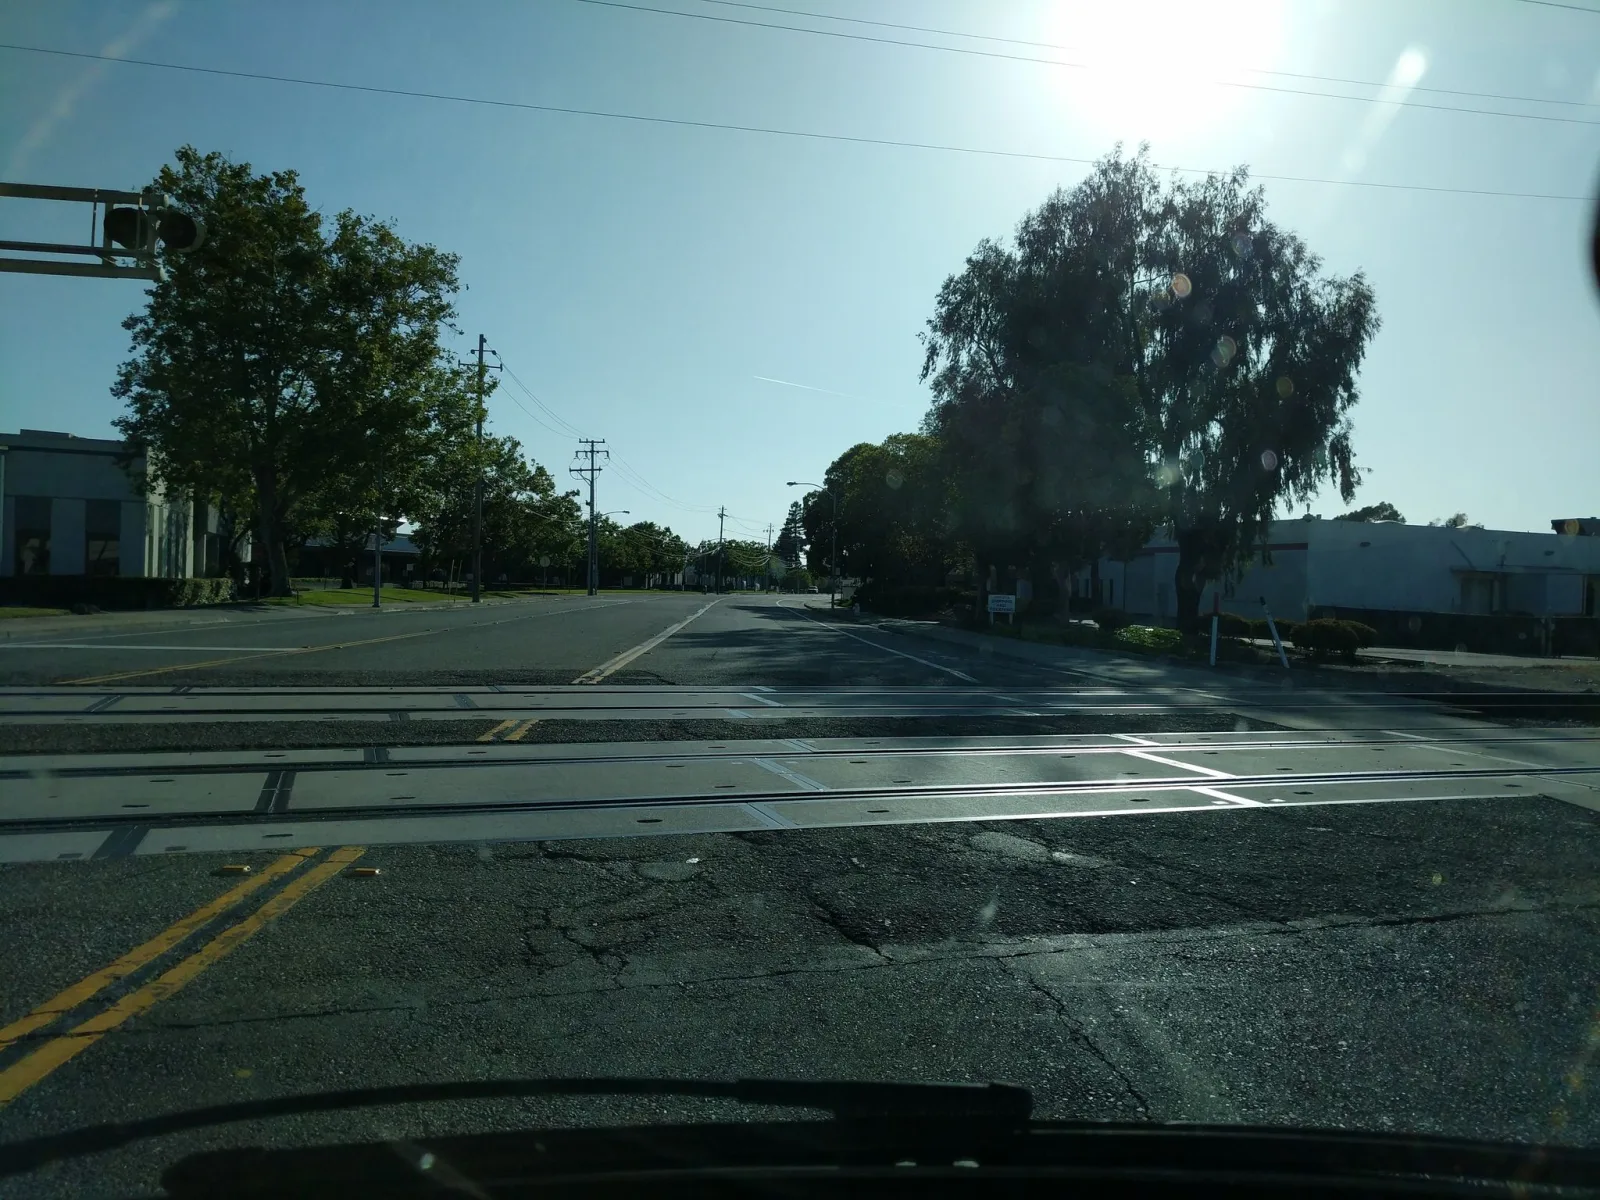
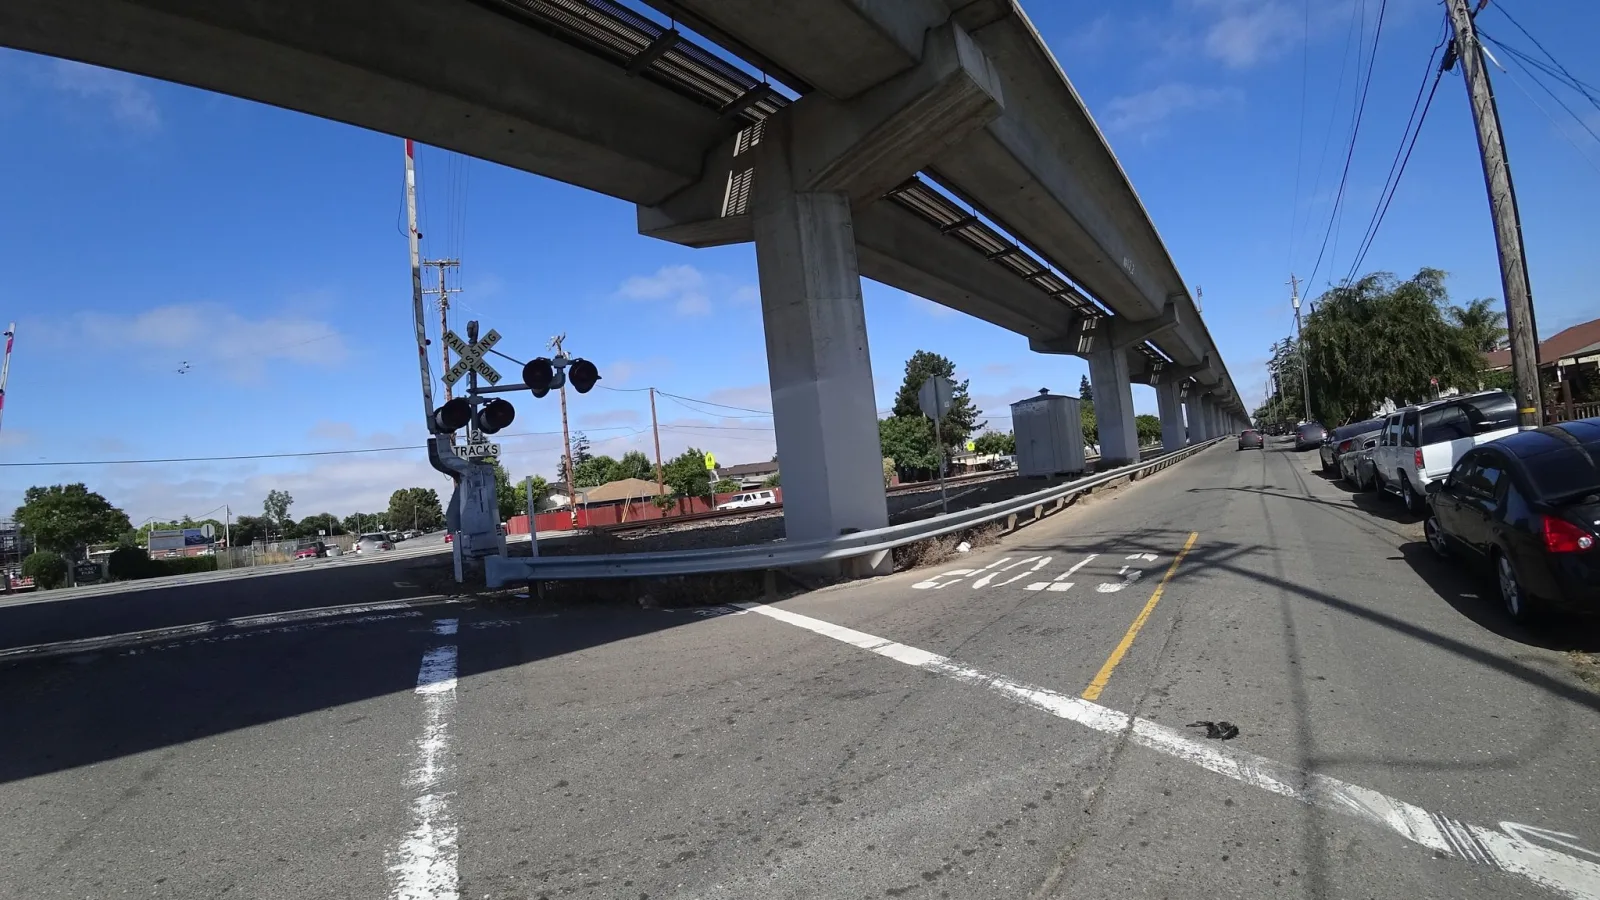
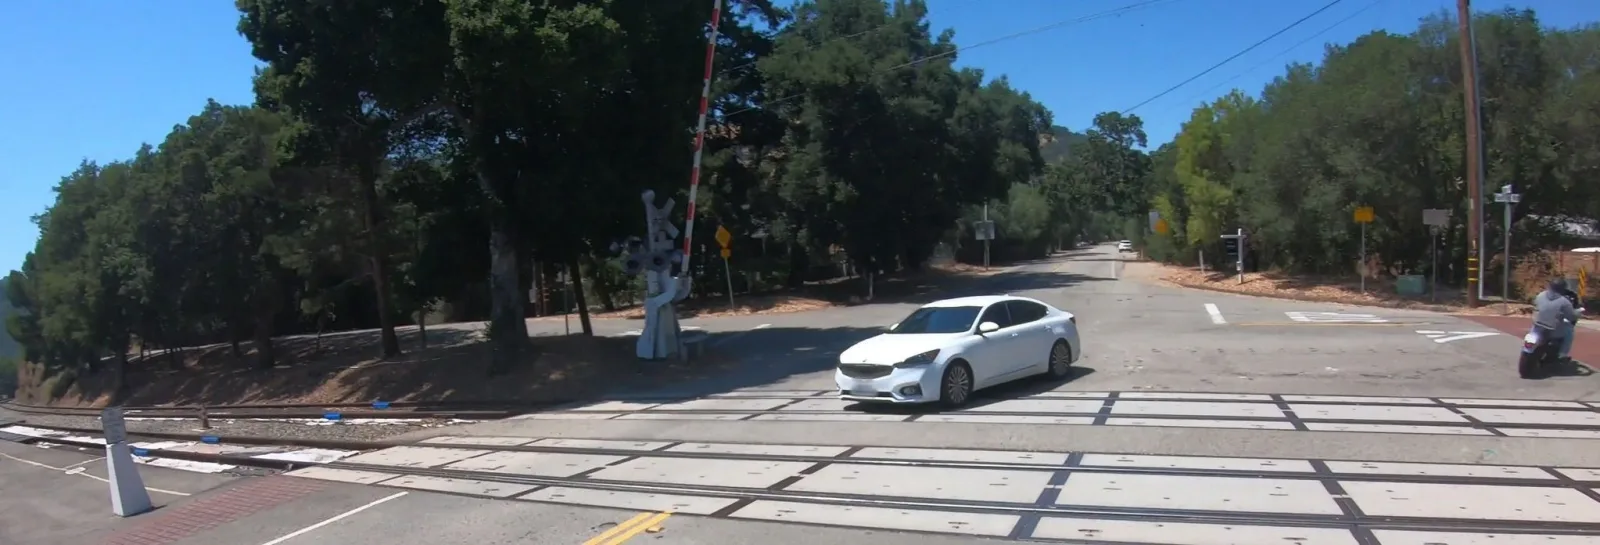
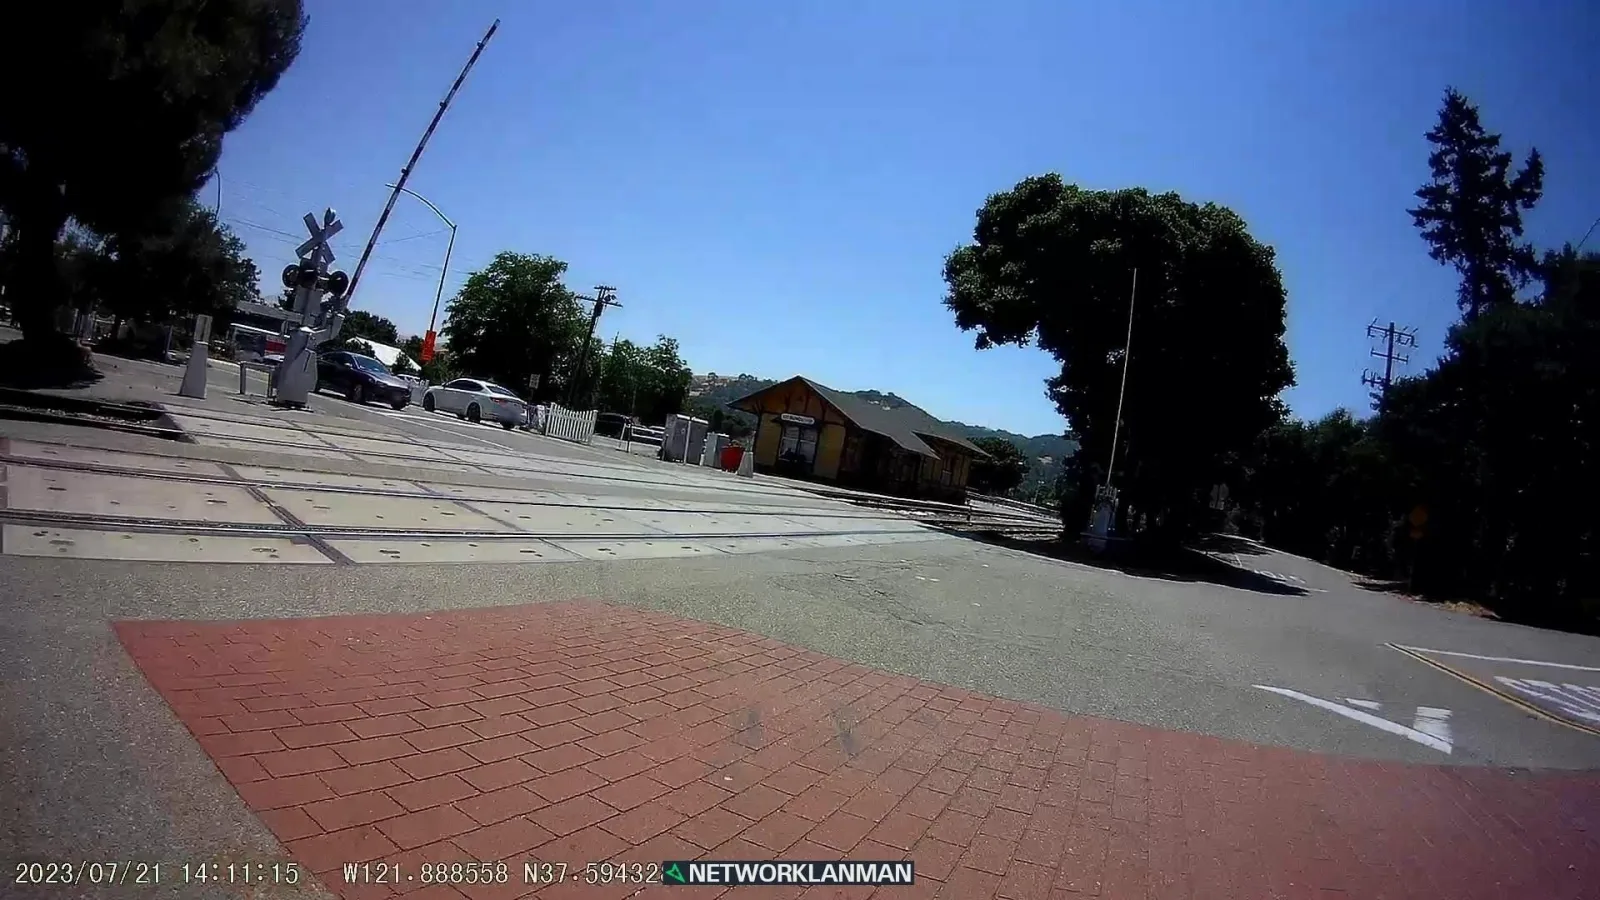
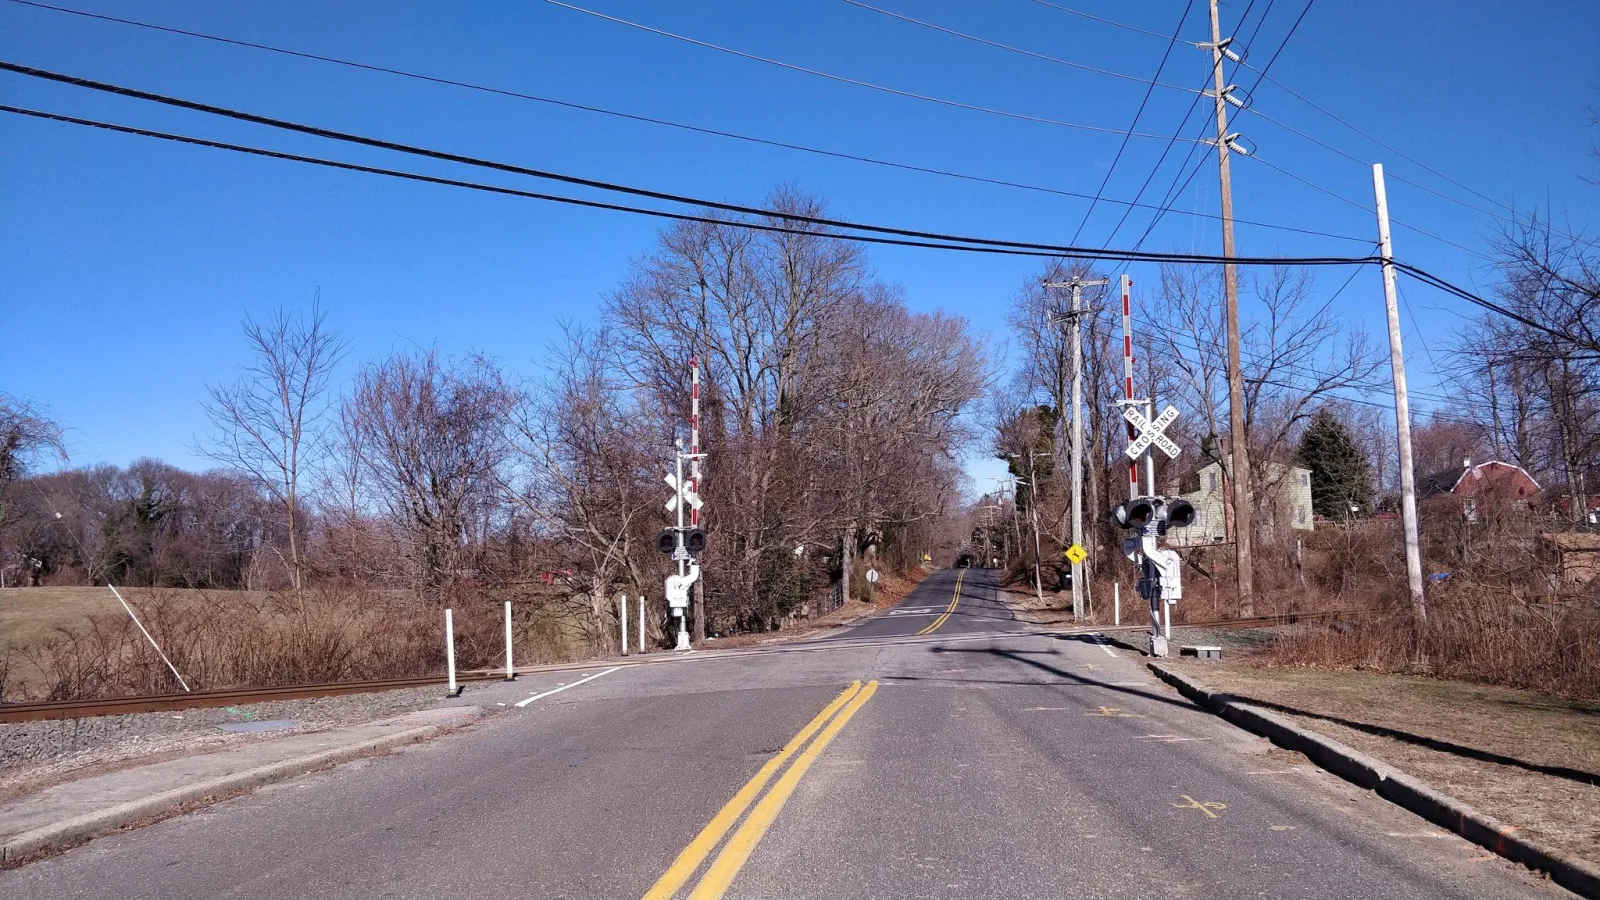
The images add the place to the record. The identifier locates the crossing. The surroundings explain why road continuity, nearby uses and local access matter before a project step is chosen.
A shared record becomes a safety reference once accident history is attached to it. The Federal Railroad Administration runs the Office of Safety Analysis, which publishes the national record of highway-rail collisions and casualties [11, ↗].
The inventory and the accident record share crossing identifiers, so a single crossing can be traced from its traffic to its protection to its incident history inside public sources alone. That link is what lets a national formula score every crossing on a comparable basis.
This is the public record a program team can start from. It gives the shared starting point before the question turns to delivery, ownership and the next project step.
3. Shared ownership at program scale
Delivery is where the United States parts from France, Great Britain and Spain. Those countries place the network under one national manager. In the United States, the crossing system works through many hands.
Six Class I freight railroads run roughly 140,000 miles of line, about 225,000 kilometers, and around 615 short line and regional railroads operate much of the rest [19, ↗]. Amtrak and the commuter authorities add passenger track on top.
The road approach at each crossing belongs to a state, county or city authority, so responsibility for a single crossing is shared between the railroad that owns the track and the authority that owns the road.
Shared ownership gives each crossing several practical viewpoints. The railroad sees the track and rail operation. The road agency sees the road approach, traffic and local access. The state program sees candidates across a wider list.
With more than 200,000 crossings, fifty state programs and many owners, the comparison question naturally widens. Public records give the common reference.
A territorial view can add a second reading where several responsibilities meet at the same crossing, especially before the next diagnostic, funding or engineering step is chosen.
4. Federal and state actors
Each actor carries the crossing through one part of its course. The Federal Railroad Administration makes the rail safety picture visible, holding the inventory and publishing the accident record [8, ↗] [11, ↗].
The Federal Highway Administration frames the road-side federal program through funding, guidance and national standards, administering Section 130, publishing the Highway-Rail Crossing Handbook and setting the national signing standard through the Manual on Uniform Traffic Control Devices [2, ↗] [4, ↗]. The roads that meet the rail network at crossings are administered and maintained across federal aid, state and local systems.
The states administer delivery, where each department of transportation runs field diagnostics, ranks its crossings, manages its Section 130 funds and coordinates with the railroad and the local road agency on each project [3, ↗].
Railroads and road agencies meet at the crossing itself, each responsible for its own side. The National Transportation Safety Board investigates major accidents and issues recommendations, as it did after the 2015 collision at Valhalla, New York and the 2017 motorcoach collision at Biloxi, Mississippi [15, ↗] [16, ↗] [17, ↗]. Operation Lifesaver carries public education on crossing safety [18, ↗].
At one crossing, these roles are practical. A diagnostic review brings the owners together because each holds a different part of the place.
Across many crossings, the same roles create a program reading shared across several desks. The public records give the first common language.
A territorial reading can then add comparable context before teams decide where the next field, grant, engineering or capital effort should go.
5. Public records and risk scoring
Railroads report the crossings on their track into the national inventory. The Federal Railroad Administration maintains that inventory and links it with the public accident record.
The same inventory variables, the road and rail traffic, the train speed, the number of tracks and the warning devices feed FRA's Grade Crossing Accident Prediction System, which ranks intersections by predicted collisions per year [20, ↗] [21, ↗]. That ranking gives program readers a public safety reference, on a common federal basis, before local diagnostics and project choices begin [14, ↗].
Because every state ranks on the same federal basis, a crossing in one state reads on the same scale as a crossing in another, and the ranking can be reproduced and checked from public data. The Highway-Rail Crossing Handbook then frames the diagnostic review and the treatment that follows, from signs and markings to active warning and grade separation [2, ↗].
The score gives a shared basis for ranking on-site risk. It reads the crossing itself.
Once money and projects enter, the decision broadens. A program team still needs the safety reference, but it may also want to compare what each candidate crossing affects around it.
6. Funding programs
Funding is where a crossing starts to draw attention, scope and timing. Section 130 supports hazard elimination at public crossings as a federally funded, state-administered set-aside inside each state's Highway Safety Improvement Program [1, ↗] [3, ↗].
The Railroad Crossing Elimination Program, created by the 2021 infrastructure law and run by the Federal Railroad Administration, supports larger grade separation and closure projects [12, ↗] [13, ↗].
Section 130 dates to the Highway Safety Act of 1973 and is codified at 23 U.S.C. 130, while the elimination program is codified at 49 U.S.C. 22909 and funded across 2022 to 2026 [5, ↗] [6, ↗] [7, ↗].
Once funding enters the sequence, the program question changes. It moves from which crossing scores high to which crossing can carry the next diagnostic, grant, engineering or capital step.
A grade separation costs far more than a warning upgrade, and money is allocated each year. A state therefore decides which crossings to put forward and in which order.
That ordering begins before engineering and before a grant application. A comparable view across many candidates can help teams place the next effort.
7. What the crossing affects around it
The score reads the crossing. A project also affects the place around it.
A closure or a separation changes how traffic moves. It changes how emergency vehicles reach an incident. It changes how nearby residents cross the line.
Those effects land in the surrounding territory. They help explain how a project carries its case, and they make territorial variables useful before the next program step.
The territory around the crossing can be observed directly. Population nearby shows who a change would affect. Road continuity and response time show how a closure would reach emergency services.
Detour dependence shows what local traffic does once a crossing closes. Land use and development pressure show how the area is changing. Flood and climate exposure on the adjoining roads show where a diversion would come under strain. Each of these can be measured, and each shifts between one diagnostic and the next.
These variables come into focus where ownership is shared, because the road side and the rail side sit with different owners. The territory around the crossing is the common ground where their decisions meet.
Reading those surroundings the same way for every crossing can help different readers compare the same candidates before they commit time, funding or engineering scope.
8. From candidate crossings to the next effort
At this point, the crossing has become a candidate for a next effort. It is still a public record and a safety score, but it is also a possible field review, grant application, engineering scope, closure, separation or capital plan.
The public inventory gives the record. Shared ownership gives the delivery setting. Federal scoring gives the safety reference. Funding gives the project sequence. The surrounding territory shows what a project may affect beyond the crossing itself.
Across many candidate crossings, the question becomes where the next field visit, grant effort, engineering scope or capital step may be best placed.
9. Reading territorial exposure before the next step
Because the inventory is public and structured, the surrounding territory can be read from the same starting point. The record already provides identifiers, geolocation, warning devices, traffic variables and ownership information [8, ↗].
A territorial exposure layer can then support three readings before the next program step.
First, it reads comparable surroundings. These include nearby population, road continuity, emergency access, detour dependence, land use, development pressure, climate exposure and functional dependence.
Second, it refreshes those variables on a regular rhythm, with monthly updates as the primary cadence and weekly updates for faster moving variables.
Third, it keeps the same definitions, the same geography and traceable sources across many crossings. One crossing can then be compared with another before engineering studies or capital decisions are committed.
The same reading can serve several reader groups without changing the official base.
For state agencies and railroads, it can support earlier comparison across candidate crossings before diagnostic review and capital programming.
For MPOs, counties, ports and cities, it can support local framing around mobility, detours, emergency access and land use.
For insurers and finance readers, the same variables can support exposure, accumulation, frequency and severity views, with the National Transportation Safety Board record as an accident reference over time [15, ↗].
For international infrastructure readers, the U.S. case helps compare how open data, public scoring, shared ownership and distributed delivery interact.
The official records stay in view. The added reading is the territory around many crossings, held with the same definitions from one place to the next.
That is the exposure layer SAMRoute studies and builds.
10. Why the U.S. case matters
This U.S. reading sits inside SAMRoute's wider comparison of grade crossing systems.
France gives the home baseline, where this type of territorial method is already implemented against the French inventory.
Great Britain and Spain give field-informed reference markets, each under a single national manager with a different funding rhythm.
The United States reads differently because open public data meets shared ownership and distributed delivery.
That is why the U.S. case matters for SAMRoute. It shows a system where the official record is already visible, where program roles are already distributed, and where a territorial reading can remain modest.
Its role is to keep the surrounding context comparable from one candidate crossing to the next, before the next program step is chosen.
11. References
Federal road-side program, methodology and signage
[1] Federal Highway Administration. Railway-Highway Crossings (Section 130) Program — overview (FHWA). Read
[2] Federal Highway Administration. Highway-Rail Crossing Handbook, Third Edition (FHWA-SA-18-040, FHWA and FRA). Read
[3] Federal Highway Administration. Rail-Highway Crossings Program (Section 130) — Questions and Answers (FHWA). Read
[4] Federal Highway Administration. Manual on Uniform Traffic Control Devices (MUTCD) (FHWA). Open
Federal statute
[5] United States. 23 U.S.C. 130 — Railway-highway crossings (Highway Safety Act of 1973, as codified). Read
[6] United States. 49 U.S.C. 22909 — Railroad crossing elimination program (as codified). Read
[7] United States Congress. Infrastructure Investment and Jobs Act (Public Law 117-58), H.R.3684 (117th Congress, 2021). Read
FRA inventory and safety data
[8] Federal Railroad Administration. U.S. DOT National Highway-Rail Crossing Inventory (FRA). Read
[9] Federal Railroad Administration. Crossing Inventory Data Search (FRA Safety Data Reporting). Open
[10] Federal Railroad Administration. Summary Statistics of the National Railroad-Highway Crossing Inventory for Public At-Grade Crossings (FRA, 1977, figures as of August 1976, cited as a historical summary and not for current counts). Read
[11] Federal Railroad Administration. Office of Safety Analysis — Safety Data portal (FRA). Open
FRA crossing elimination program
[12] Federal Railroad Administration. Crossing Safety Program and Railroad Crossing Elimination (RCE) Grant Program (FRA). Read
[13] Federal Railroad Administration. Railroad Crossing Elimination Grant Program (FRA competitive discretionary grant programs). Read
Prioritization
[14] Federal Highway Administration. Highway-Railway Grade Crossing Action Plan and Project Prioritization — background on prioritization (FHWA). Read
Independent accident investigation
[15] National Transportation Safety Board. Office of Railroad, Pipeline, and Hazardous Materials Investigations (NTSB). Open
[16] National Transportation Safety Board. Highway-Railroad Grade Crossing Collision, Commerce Street, Valhalla, New York, 3 February 2015 (NTSB/RAR-17/01). Read
[17] National Transportation Safety Board. Motorcoach collision with CSX freight train at the Main Street grade crossing, Biloxi, Mississippi, 7 March 2017 (HWY17MH010). Read
Public awareness
[18] Operation Lifesaver. Rail safety education (Operation Lifesaver, Inc.). Open
Network ownership
[19] Association of American Railroads. Freight Rail Facts & Figures (AAR). Read
Accident prediction model
[20] Federal Railroad Administration. Grade Crossing Accident Prediction System (GXAPS) (FRA). Read
[21] Federal Highway Administration. Highway-Rail Crossing Handbook, Third Edition — Appendix C: Assessment of Crossing Safety and Operation (FHWA). Read